
Car Accidents in San Francisco, CA: Police Reports and Crash Data
Key crash statistics, high-risk roads, and accident report resources in San Francisco, CA.
Our San Francisco-based accident reporting team tracks crash data, analyzes official reports, and keeps up with local news to help everyone who drives, walks, or bikes in the city. We see firsthand how major routes like Market Street, Van Ness Avenue (US 101), and I-80 over the Bay Bridge impact daily life, along with the unique challenges of San Francisco’s steep hills and crowded streets.
We’re dedicated to making San Francisco crash data and road safety information clear and accessible. By breaking down the latest statistics, highlighting high-risk intersections, and sharing practical tips, our team hopes to help drivers, pedestrians, and cyclists make safer choices every day.
If you’ve been involved in a car accident in San Francisco, CA, or want to learn more about crash trends and road safety in your neighborhood, you’re in the right place. Read on for a detailed look at San Francisco crash statistics, step-by-step instructions for getting police reports, and resources to help you stay safe in the city.
San Francisco Police and CHP Crash Reports
The San Francisco Police Department investigates crashes that happen on city streets. If your crash happened on a freeway, it’s handled by the California Highway Patrol’s San Francisco Area office at 455 Eighth Street. Their coverage area stretches from the Bay Bridge toll plaza through the city and down the Peninsula to Millbrae. Since San Francisco is both a city and a county, there’s no unincorporated land here, so all crashes happen within city limits.
San Francisco Police Department collision reports are free. You can request one in person at the Crime Information Services Unit (1245 3rd Street, 1st Floor) on weekdays from 8 a.m. to 5 p.m. (except holidays), or online through the department’s Incident Report Request Portal. To request online, you’ll need to create an account and upload a driver’s license, SF City ID, state ID, or passport. Reports are usually available at least five business days after the crash, once reviewed and approved. California law limits collision reports to people directly involved, such as drivers and vehicle owners.
For crashes handled by the California Highway Patrol, fill out a CHP 190 form and send it to the San Francisco Area office by mail or bring it in person, along with a copy of your photo ID or a notarized signature. The fee is $10 for up to 25 pages. Drivers, passengers, vehicle or property owners, and parents or guardians of minors can request these reports.
California law also requires drivers to file an SR-1 form with the DMV within 10 days if anyone was hurt or killed (even slightly), or if property damage exceeds $1,000, no matter who was at fault. A police report does not replace this requirement.
Not sure which agency holds your report? We can help you find out. Our California accident resources cover the rest of the state.
San Francisco Traffic Deaths and Injury Crashes, 2023 to 2026
| Measure | Figure | Year | Source |
| People killed in traffic crashes, city streets | 25, down from 43 in 2024 | 2025 | SFMTA, SF Department of Public Health and SFPD |
| People killed in traffic crashes, January to June | 14 (11 walking), up from 13 a year earlier | 2026 | Vision Zero SF monthly memo |
| Pedestrians killed | 24 of 43 deaths | 2024 | Vision Zero SF 2024 End of Year Report |
| Injury collisions on city streets | 2,954 (2,889 in 2023) | 2024 | SF Collisions Report 2023-2024 |
| Pedestrians killed or injured | 648, worst of 15 large California cities | 2023 | California Office of Traffic Safety |
| Bicyclists killed or injured | 397, worst of 15 large California cities | 2023 | California Office of Traffic Safety |
The 2025 count comes from the joint SFMTA, Public Health and police release of January 2026, and the 2024 figures from the Vision Zero SF year-end report, which called 2024 the deadliest year since 2005. These city counts leave out the freeways under Caltrans jurisdiction, so a death on I-80, I-280, or the US 101 freeway, the roads the CHP covers, is not in them. They also leave out the Presidio and SFO, which sit in San Mateo County. Walk SF counted 16 pedestrians among the 2025 dead, 12 of them seniors.
San Francisco Intersections With the Most Injury Crashes
San Francisco’s High Injury Network includes just 12% of city streets, but more than 68% of severe and fatal traffic injuries happen there. In 2024, 19 out of 43 people killed in traffic crashes died on these streets. The SF Collisions Report ranks intersections by the number of injury crashes from 2020 to 2024, and these are among the eight with the highest totals.
Market Street, from Van Ness Avenue to Octavia Street: Gough Street and Market saw 40 injury crashes, the most of any intersection in the city, though none were fatal. Market and Octavia had 38, and Market and Van Ness had 27, placing three of the city’s highest-risk intersections on this short stretch of Market Street.
Eddy Street and Larkin Street: This intersection had 28 injury crashes and 2 fatal crashes over five years. It’s the only intersection among the top eight where a crash resulted in a fatality.
Divisadero Street and Geary Boulevard: There were 28 injury crashes here from 2020 to 2024, tying it with Eddy and Larkin.
19th Avenue and Junipero Serra Boulevard: This intersection saw 27 injury crashes over the same five-year period. According to a May 2025 resolution from the city’s Youth Commission, this spot serves as an entrance to SF State and two residential neighborhoods, with 15 injury crashes reported there from 2014 to 2018.
Ulloa Street and Lenox Way, West Portal: The deadliest single crash of 2024 happened here on March 16, when a speeding SUV went onto the sidewalk and killed four pedestrians, according to the Vision Zero SF year-end report.
Looking at different areas of the city, the East Central and South of Market districts had the most injury crashes from 2020 to 2024, with 2,352 incidents, a 22% drop compared to before the pandemic. The only district where injury crashes increased was in the southeast, covering Bayview and Visitacion Valley, which saw a 7% rise.
San Francisco’s Level I Trauma Center
Zuckerberg San Francisco General Hospital and Trauma Center (1001 Potrero Avenue) is the city’s only Level I trauma center, and also serves northern San Mateo County. It’s located next to the stretch of the US 101 Bayshore Freeway between Cesar Chavez Street and 17th Street, a section Caltrans refers to as Hospital Curve.
Frequently Asked About San Francisco Crashes
How many people died in San Francisco traffic crashes in 2025?
Twenty-five people died on San Francisco’s city streets in 2025, a 42% drop from the 43 killed in 2024, which was the most deaths since 2005. These numbers do not include crashes that happened on Caltrans freeways. By the end of June 2026, the city had counted 14 deaths, one more than at the same point in 2025.
Which San Francisco intersection has the most injury crashes?
Gough Street and Market Street had 40 injury crashes from 2020 to 2024, the highest of any intersection in the city’s collisions report. Market Street and Octavia Street, just down the road, came in second with 38. Neither intersection had a fatal crash during those five years.
How do I get a San Francisco police crash report?
SFPD crash reports are free. You can request one online through the department’s Incident Report Request Portal (after uploading a photo ID), or in person at 1245 3rd Street on weekdays from 8 a.m. to 5 p.m. Wait at least five business days after the crash so the report can be reviewed and released.
Are pedestrians at higher risk in San Francisco?
Yes. The California Office of Traffic Safety ranked San Francisco worst among 15 large California cities in 2023, with 648 people killed or injured while walking. Pedestrians made up 24 of the 43 traffic deaths on city streets in 2024, and 11 of the 14 killed through June 2026.
For those seeking additional information and support regarding traffic accidents in California, you can explore various local resources dedicated to accident safety and prevention. These resources provide valuable insights and assistance in navigating the aftermath of accidents. To learn more, visit our comprehensive guide on California local accident resources.
San Francisco Accident Reports on Local Accident Reports
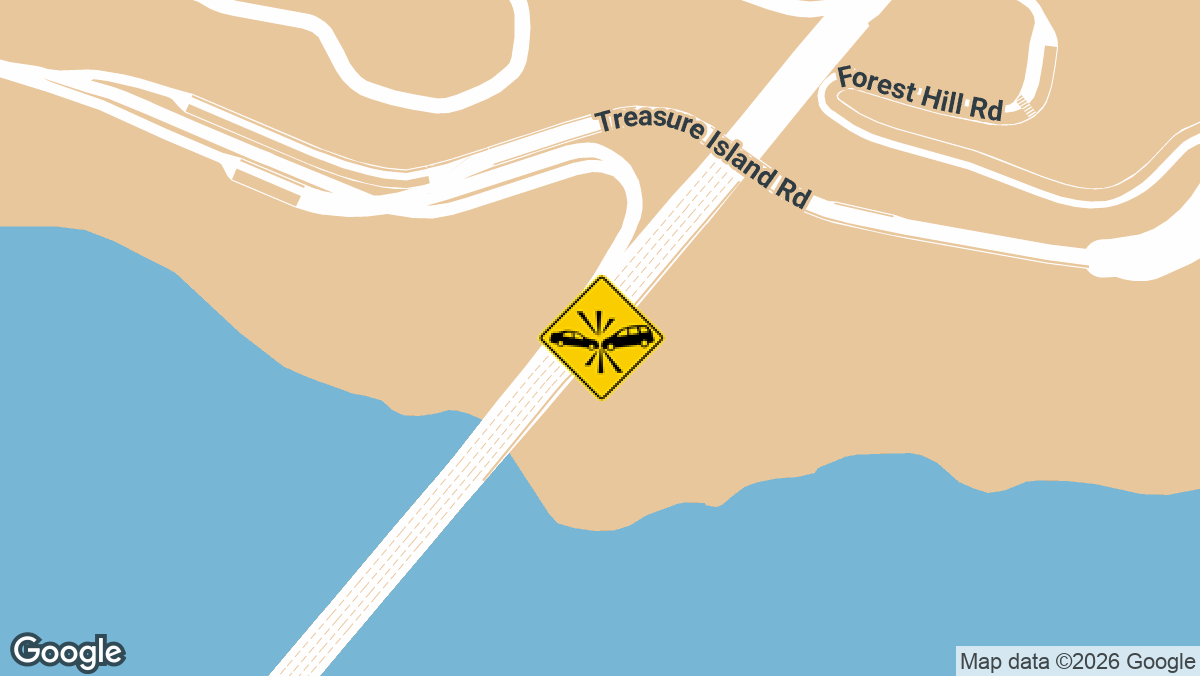
Two-Vehicle Injury Crash on I-80 EB Near Treasure Island in San Francisco, CA
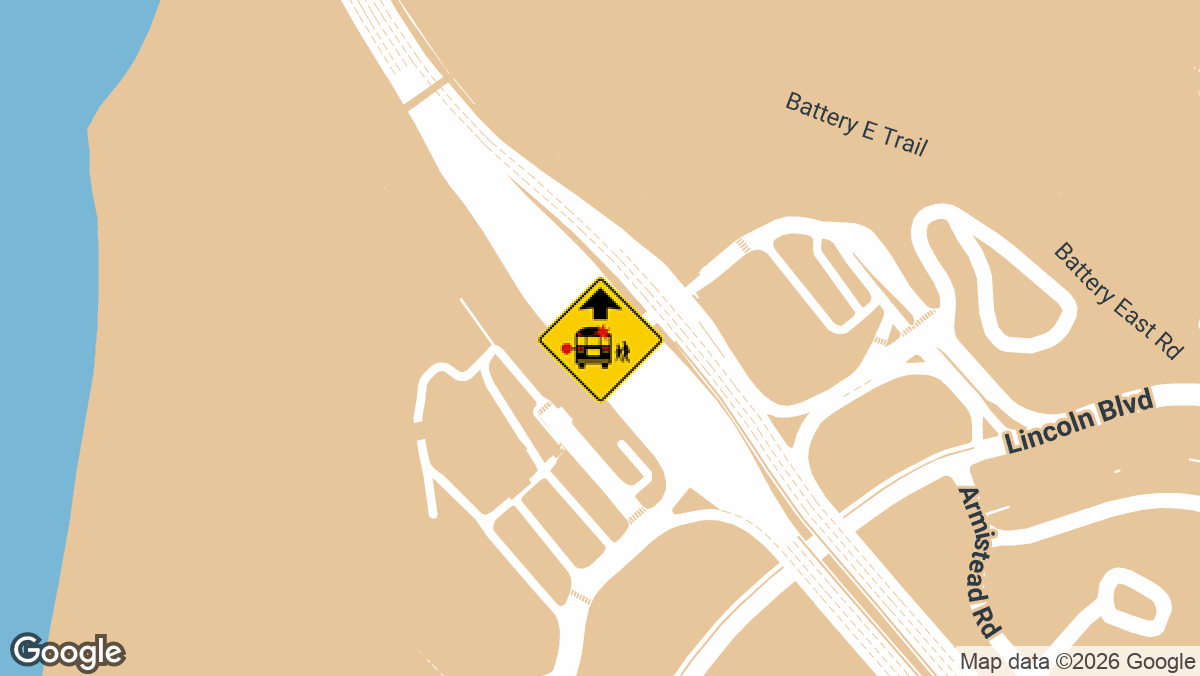
Bus Crash on US-101 SB Near Golden Gate Bridge in San Francisco, CA
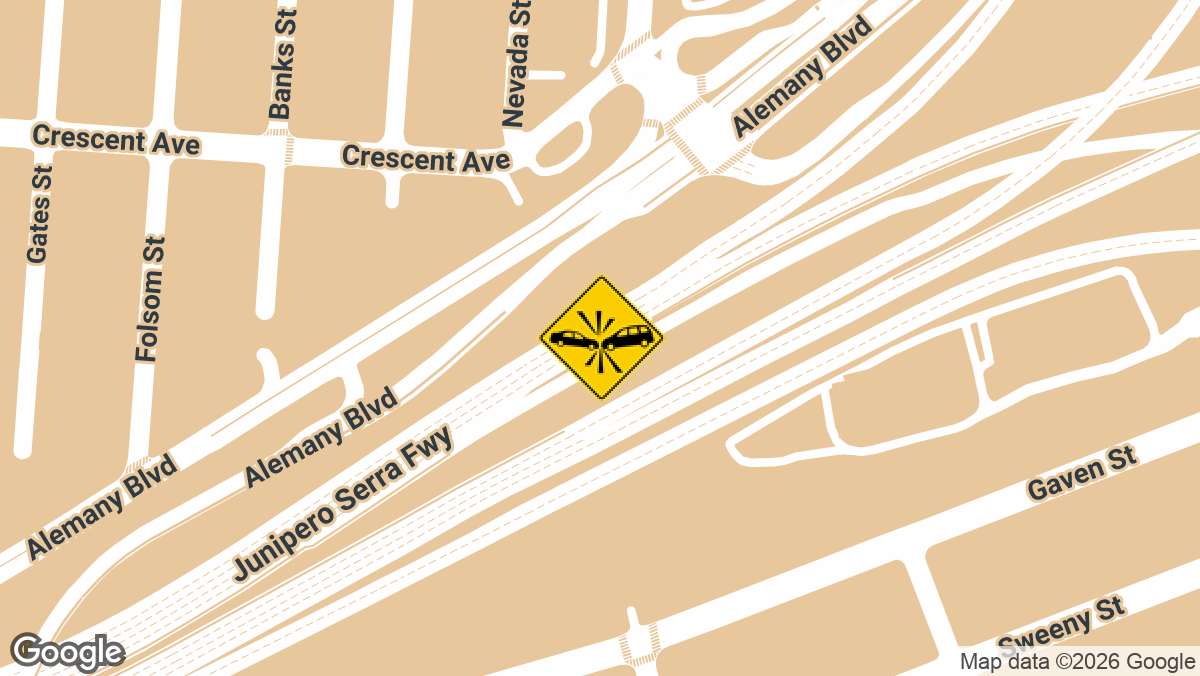
Hit-and-Run Crash Injures Driver on SB I-280 at US-101 in San Francisco, CA
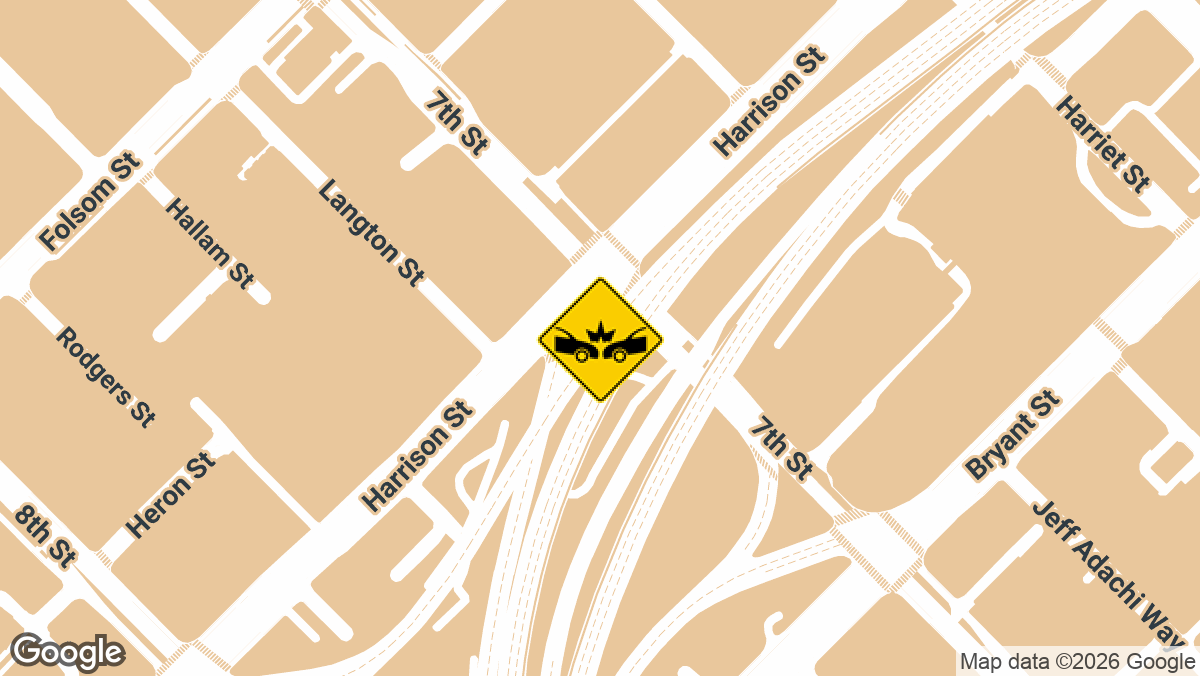
Multi-Vehicle Crash on I-80 WB at Yerba Buena Island Ramp in San Francisco, CA
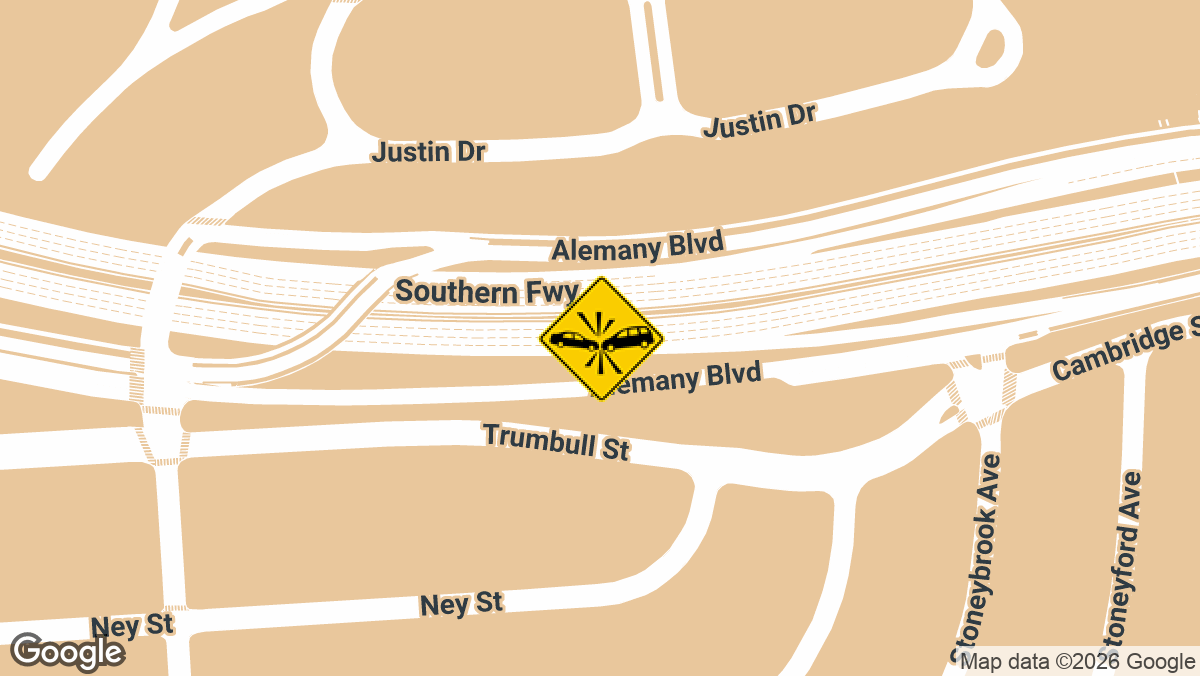
Minor-Injury Crash on I-280 NB Near Alemany Blvd in San Francisco, CA
At Local Accident Reports, we cover crashes in all fifty states. But that’s not all; we also report the latest crashes county by county, not just state by state. Our goal is to give drivers and other road users reliable, up-to-date crash information for any location they’re interested in.
Here you can find some of the most recent crashes in San Francisco, where the city and the county are the same place, so every crash here happened inside the city, including on I-80 out at Yerba Buena Island. Read recent city street reports and the full archive, available at our San Francisco accident news.
San Francisco has company. Crash-prone intersections across California turn up in cities up and down the state, and recent accident alerts post new wrecks as they are reported.
Local Accident Reports compiles this information from public agency sources and published reports for general reference. It is not legal advice and is not an official police record. Fees, forms and deadlines change, so confirm with the agency before you send a request. Last updated October 2026.