
Car Accidents in Boston, MA: Police Reports and Crash Data
Key crash statistics, high-risk roads, and accident report resources in Boston, MA.
We focus on the local details that matter most. Whether you’re searching for Boston accident reports, crash data by neighborhood, or high-risk intersections in Suffolk County, we gather information from city, regional, and state sources. We highlight Boston’s crash hotspots, including Mass Ave & Cass, Blue Hill Avenue, and Morton Street, and translate complex statistics into clear, helpful insights for everyone who uses Boston’s roads.
Our team tracks new safety projects, city initiatives like Vision Zero, and updates to Boston’s road network that affect drivers from South Boston to Roxbury and beyond. We organize all this local information to support residents, commuters, and anyone looking for accident resources or the latest news on Boston car crashes.
If you’ve been involved in a car accident in Boston, MA, or want to learn more about crash trends and road safety in your neighborhood, you’re in the right place. Read on for a detailed look at Boston crash statistics, step-by-step instructions for getting police reports, and resources to help you stay safe in the city.
Boston Police or State Police: Who Has Your Crash Report
The Boston Police Department handles crashes on city streets. Massachusetts State Police cover I-93, the Mass Pike, the Sumner, Callahan and Ted Williams tunnels, the Tobin Bridge and the state’s DCR parkways, including Storrow Drive, Soldiers Field Road, the Jamaica Way, the Riverway and Park Drive. The State Police Boston barracks is at 250 Leverett Circle, with a desk staffed around the clock at (617) 727-6780.
Boston Police reports come from the Licensing Division’s Public Service Unit, on the first floor of headquarters at One Schroeder Plaza in Roxbury. It’s open weekdays from 8:30 a.m. to 4 p.m. (617-343-4633), and requests need valid photo ID, in person or by email to [email protected] with the crash date, location, the people involved, and a copy of the ID. The department’s request page lists no fee or turnaround. According to a 2017 city form, the search fee is $5, cash only.
Any Massachusetts police crash report, State Police reports included, can be ordered from the Registry of Motor Vehicles for a $20 non-refundable search fee. Request it online through the myRMV Online Service Center or by mail to RMV Crash Records, P.O. Box 55889, Boston, MA 02205, with a check or money order payable to MassDOT. Allow four weeks; the RMV keeps searching for 90 days. Drivers, owners, occupants, witnesses, vulnerable users, and property owners can all ask.
Massachusetts also puts a report on the driver. When a crash kills or injures anyone, or does more than $1,000 in damage to any one vehicle or other property, the operator must file a Motor Vehicle Crash Operator Report within five days, with copies to the RMV, to the local or State Police where it happened, and to the insurer. If the operator is incapacitated, the owner files it, and the Registrar can suspend or revoke the license of anyone who fails to file.
Not sure which agency holds your report? We can help you find out. Our Massachusetts accident resources cover the rest of the state.
Traffic Deaths and Serious Crashes in Boston
| Measure | Figure | Year | Source |
| Traffic crash fatalities | 11 | 2025 | Boston City Council resolution, citing MassDOT and Boston’s Vision Zero Dashboard |
| Fatal crashes | 17 | 2022 | Boston Region MPO Vision Zero Action Plan (MassDOT crash data) |
| Serious-injury crashes | 23 | 2022 | Boston Region MPO Vision Zero Action Plan (MassDOT crash data) |
| Fatal and serious-injury crashes, five-year total | 320 | 2018 to 2022 | Boston Region MPO Vision Zero Action Plan (MassDOT crash data) |
| Fatal and serious-injury crashes involving a pedestrian | 88 | 2018 to 2022 | Boston Region MPO Vision Zero Action Plan (MassDOT crash data) |
| Fatal and serious-injury crashes involving a bicyclist | 24 | 2018 to 2022 | Boston Region MPO Vision Zero Action Plan (MassDOT crash data) |
The 2025 count comes from a July 2026 Boston City Council resolution recommitting the city to Vision Zero, which draws on MassDOT and the city’s Vision Zero dashboard and says most of those deaths involved a pedestrian. The other rows come from the Boston Region Metropolitan Planning Organization’s Vision Zero Action Plan, built on MassDOT crash data, where 2022 is the most recent year published. Fatal crashes there ran 13, 12, 14 and 21 from 2018 through 2021, and serious-injury crashes ran 83, 66, 29 and 42.
The city’s draft 2024 Vision Zero update puts fatal crashes at 10 to 15 a year in recent years, down from 15 to 20 a year before 2016. Boston’s own Vision Zero data leaves out deaths on State Police roads such as I-93, the Mass Pike and Storrow Drive, on private property and on streets the city doesn’t own, so highway deaths are missing from the city’s counts.
Where Boston’s Serious Crashes Happen
The Boston Region MPO ranks Boston’s high-injury street segments using MassDOT crash data from 2018 to 2022, and its top five run along Massachusetts Avenue, Harrison Avenue, Blue Hill Avenue and Morton Street.
Massachusetts Avenue and Melnea Cass Boulevard, South End and Roxbury. Known as Mass. & Cass, the intersection had 49 pedestrians struck from January 2015 to May 2024, and a 2024 Boston Globe analysis of city crash data called it “the single most perilous spot for crashes.” In the same analysis, Mass Ave at Melnea Cass and at Albany Street together logged 220 crashes, 86 involving pedestrians and 27 involving cyclists. The MPO ranks Mass Ave from Columbus Avenue to Melnea Cass first on its Boston list and the stretch from Melnea Cass to Enterprise Street second. The city’s 2024 draft Vision Zero update names a Massachusetts Avenue South project running from Melnea Cass to Columbia Road.
Harrison Avenue, East Canton Street to Warren Place. This segment ranks third on the MPO’s Boston high-injury list.
Blue Hill Avenue, Brookford Street to Seaver Street. Fourth on the MPO’s list, on a corridor through Mattapan, Dorchester and Roxbury. Across Blue Hill Avenue as a whole, the city counts one crash needing emergency services every three days and crashes per half-mile in the top 3 percent of Boston streets, and 37,000 riders use the corridor each day. The city’s redesign covers the stretch from River Street to Warren Street.
Morton Street, Harvard Street to Circuit Drive, Mattapan and Dorchester. Fifth on the MPO’s list, heading toward Franklin Park. The Globe’s 2024 analysis also named Morton Street, from Jamaica Plain to Dorchester, as a high-crash corridor.
American Legion Highway and Walk Hill Street, Roslindale. In a 2024 Boston Globe analysis, the city’s transportation chief called American Legion Highway “one of the highest crash roads,” and the Globe described the corners at Walk Hill Street as too “swoopy.” The city’s 2024 draft Vision Zero update includes a lane reduction on American Legion Highway to bring speeds down.
Trauma Centers in Boston
Boston has five adult Level I trauma centers and three pediatric Level I centers on the Massachusetts Department of Public Health’s trauma destination list. Boston Medical Center’s Menino Pavilion at 751 Albany Street and Massachusetts General Hospital at 55 Fruit Street, with Mass General for Children, are Level I for both adults and children. Brigham and Women’s Hospital at 75 Francis Street, Beth Israel Deaconess Medical Center’s West Campus at 190 Pilgrim Road, and Tufts Medical Center at 800 Washington Street are adult Level I centers. Boston Children’s Hospital at 300 Longwood Avenue is a Level I pediatric center.
In addition to understanding the crash data and road safety measures, it’s important to be aware of local resources available to you. For further information on reporting accidents and navigating the aftermath of a crash, you can explore the Massachusetts local accident resources. This comprehensive guide provides valuable insights on obtaining police reports, connecting with trauma centers, and understanding your rights after an accident. Access these resources to ensure you are well-informed and prepared.
Frequently Asked Questions About Boston Crashes
Which Boston intersection has the worst crash record?
Massachusetts Avenue and Melnea Cass Boulevard, known as Mass. & Cass, was called the single most perilous spot for crashes in a 2024 Boston Globe analysis of city data, with 49 people on foot hit there between January 2015 and May 2024. The Boston Region MPO also ranks the Mass Ave stretch leading into it first on Boston’s high-injury network.
How many people die in Boston traffic crashes each year?
Boston recorded 11 traffic crash fatalities in 2025, most of them involving a pedestrian, according to a July 2026 City Council resolution citing MassDOT and the city’s Vision Zero dashboard. MassDOT data compiled by the Boston Region MPO shows the city’s fatal crashes ranging from 12 to 21 a year between 2018 and 2022.
How do I get a Boston Police crash report?
Crash reports can be obtained at the Boston Police Public Service Unit on the first floor of One Schroeder Plaza, open weekdays 8:30 a.m. to 4 p.m., with valid photo ID, or by email at [email protected] with crash details and a copy of the ID. According to a 2017 city form, the search fee is $5 in cash.
Who handles a crash on Storrow Drive or in the Boston tunnels?
Massachusetts State Police handle crashes on Storrow Drive, Soldiers Field Road and the other DCR parkways, along with I-93, the Mass Pike, the Sumner, Callahan and Ted Williams tunnels and the Tobin Bridge. Copies of those reports come through the RMV for a $20 search fee, online through myRMV or by mail, and the RMV says to allow four weeks.
Suffolk County Accident Reports on Local Accident Reports
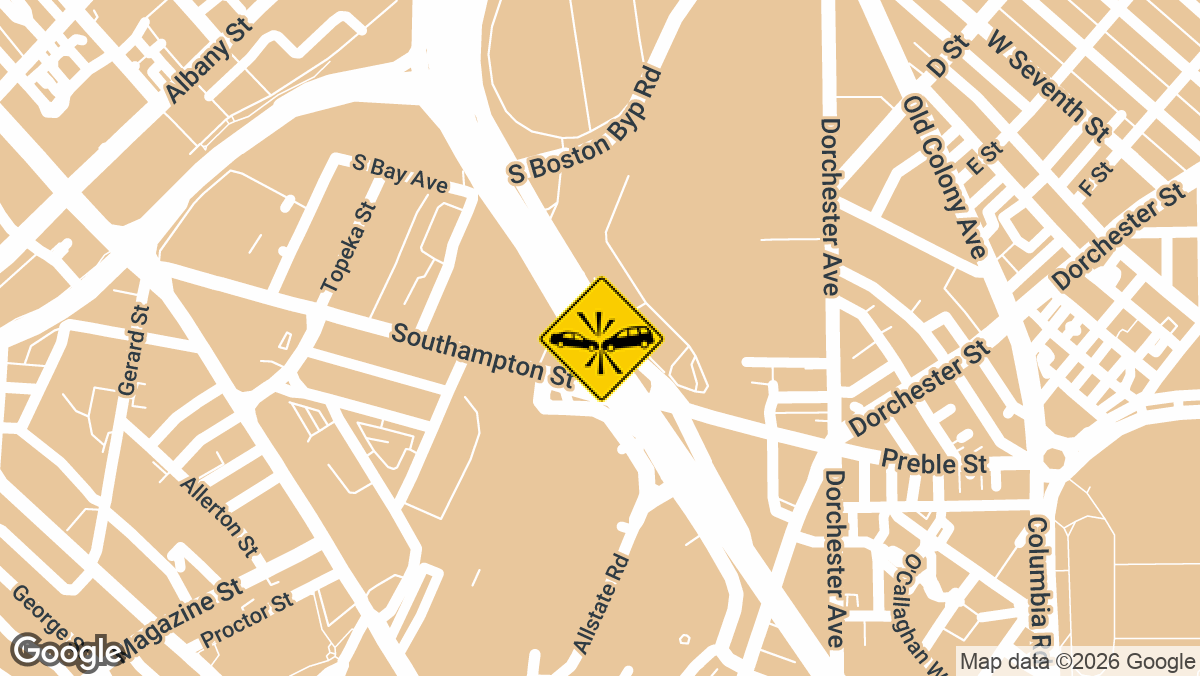
Multi-Vehicle Crash Inside O’Neill Tunnel Snarls I-93 NB in Boston, MA
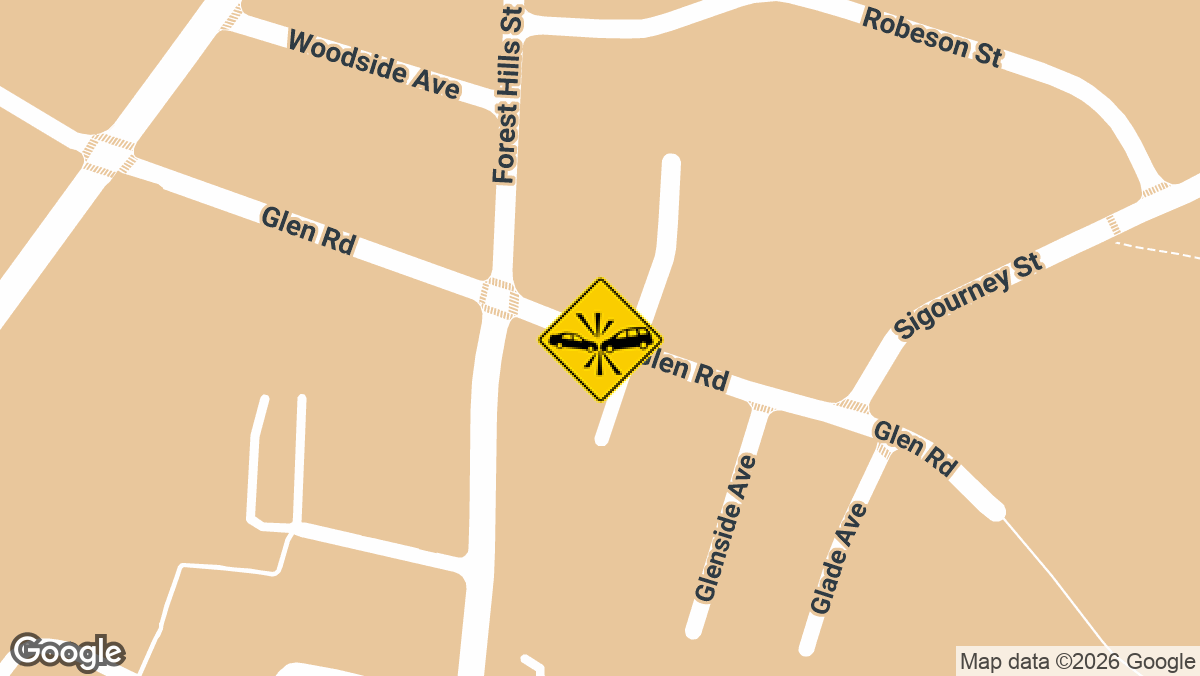
Car Crashes Into Home on Glen Rd in Jamaica Plain, MA
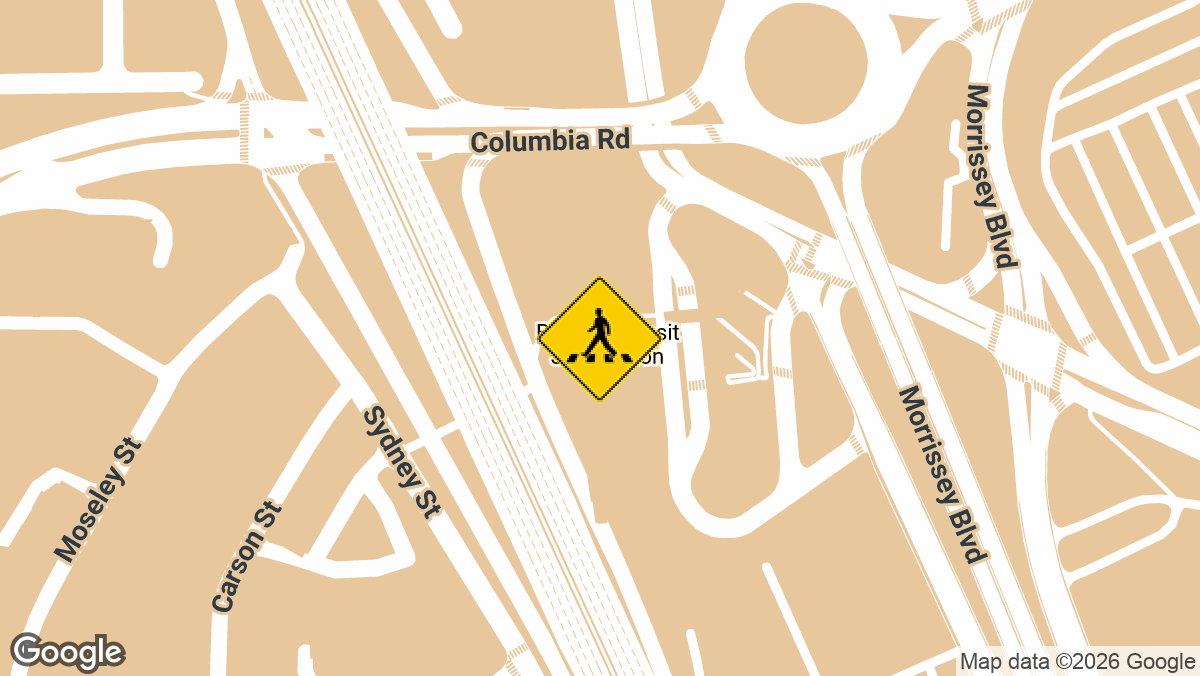
Woman Struck by Red Line Train at JFK/UMass Stop in Boston, MA
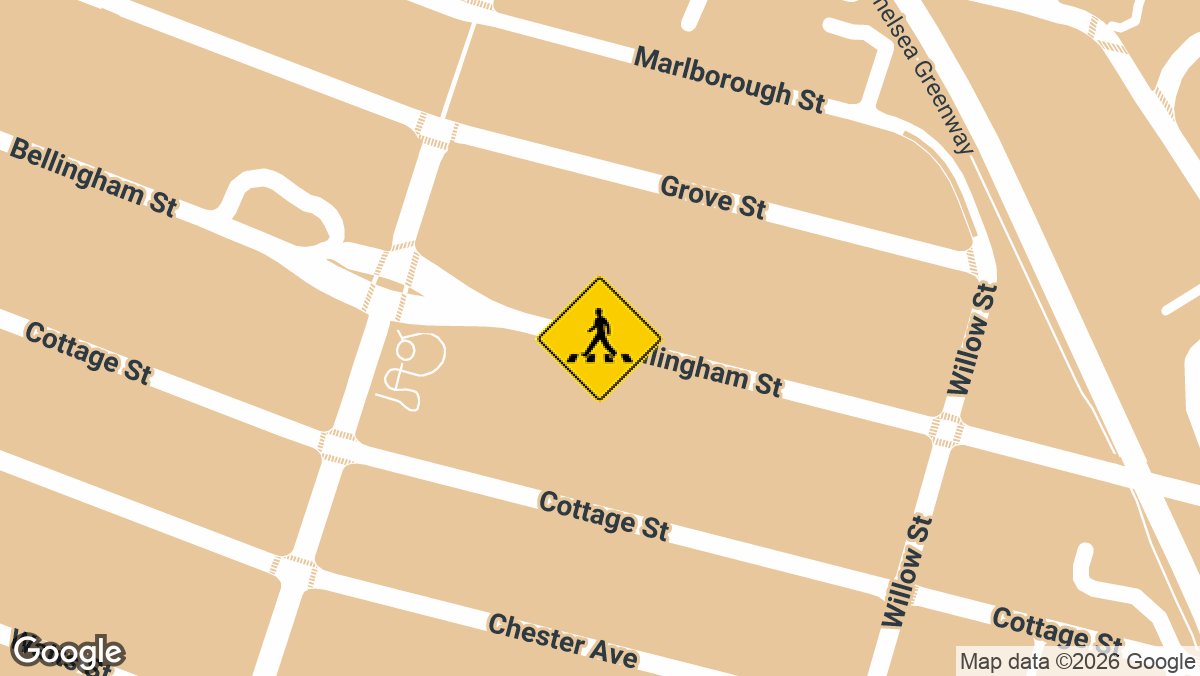
Toddler Killed in Backing Vehicle Crash on Bellingham St in Chelsea, MA
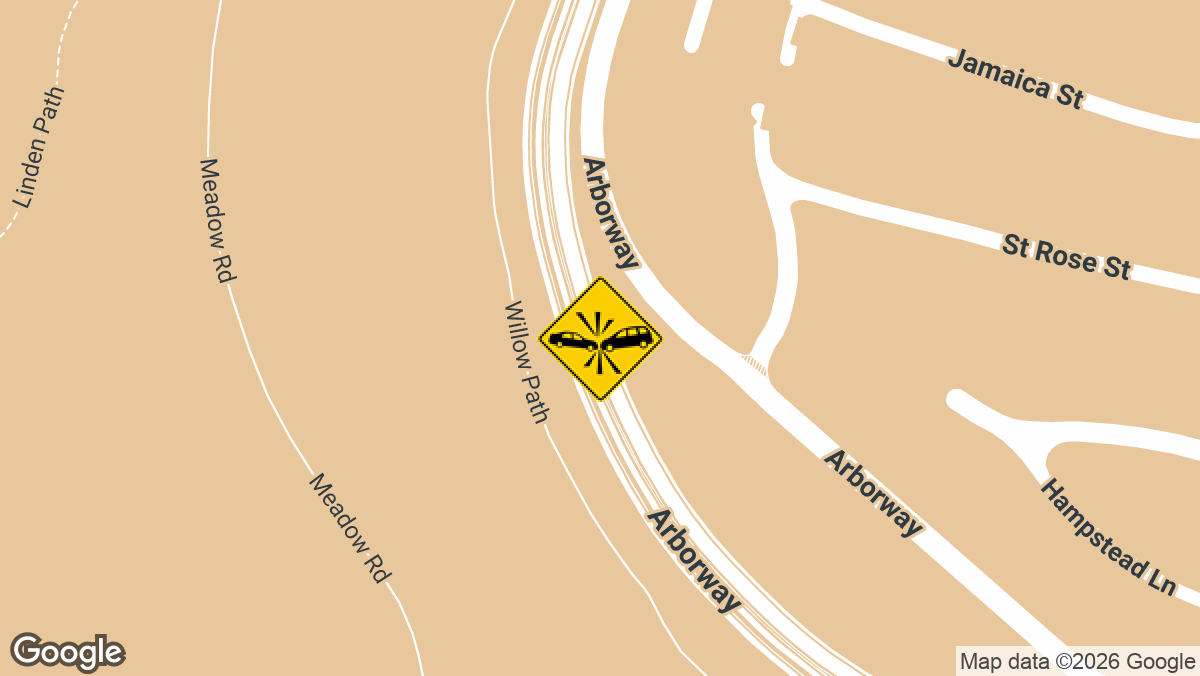
Fatal Crash on Arborway in Jamaica Plain, MA
Local Accident Reports covers crashes in all fifty states and reports the latest incidents county by county, not just state by state. The goal is to provide drivers and road users with reliable, up-to-date crash information for any location of interest.
Here you can find some of the most recent crashes in Suffolk County, which covers Boston along with Chelsea, Revere, and Winthrop. The full archive is at Suffolk County accident news.
Boston’s trouble spots have company across the state. High-crash roads and intersections in Massachusetts are gathered on one page, and recent accident alerts pick up new crashes as they are reported.
Local Accident Reports compiles this information from public agency sources and published reports for general reference. It is not legal advice and is not an official police record. Fees, forms and deadlines change, so confirm with the agency before you send a request. Last updated October 2026.